HubSpot 2022 Diversity, Inclusion, & Belonging Report

Download 2022 report

At HubSpot, we aspire to build a company that reflects the diversity of our customers. A company where inclusion and equity are embedded into everything we do. Over the past year, we’ve made progress on this journey and we start 2022 ready to keep pushing forward. That’s why we’re proud to share our 2022 Diversity, Inclusion, & Belonging Report with you. We hope it gives you a glimpse into the steps we’ve taken to build a more equitable company, and the work ahead of us to drive real, lasting change.

2022 Data

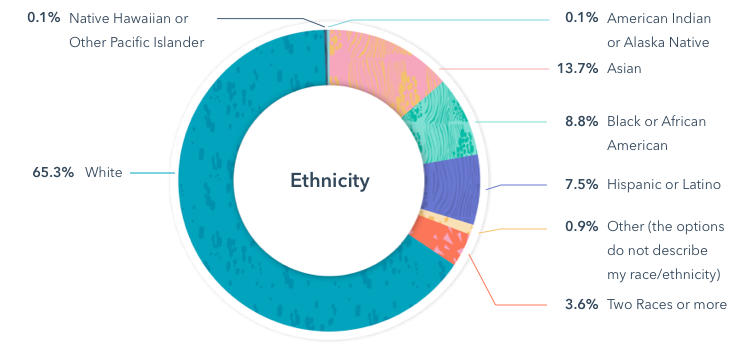
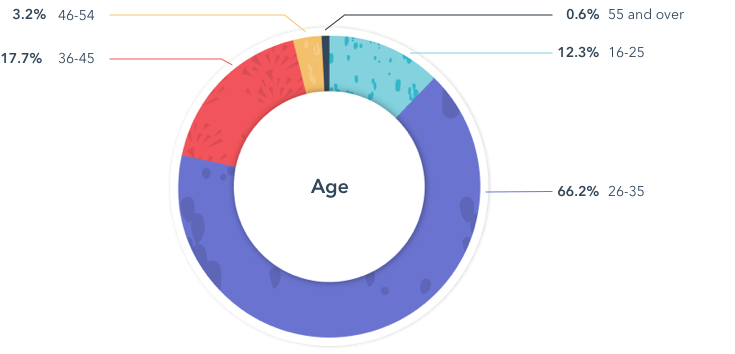
Below is HubSpot employee data as of January 1, 2022. Gender and age data is global, and ethnicity data is U.S.-only. To view more data and information, download the PDF below.
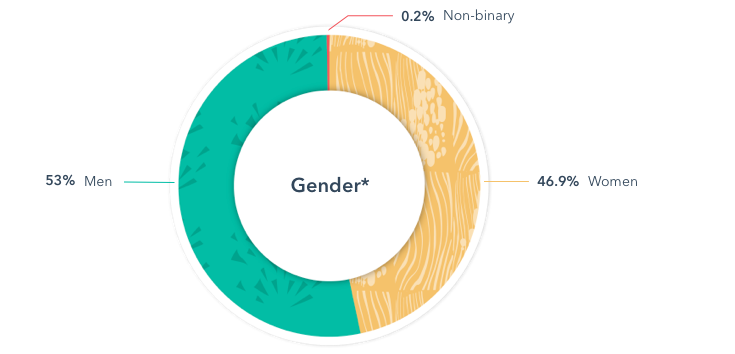
Download 2022 report
Gender*: Chart of gender distribution among surveyed HubSpot employees, 53% Men, 46.9% Women, 0.2% Non-Binary
Ethnicity: 65.3% White, 0.1% Native Hawaiian or Other Pacific Islander, 0.1% American Indian or Alaska Native, 13.7% Asian, 8.8% Black or African American, 7.5% Hispanic or Latino, 0.9% Other (the options do not describe my race/ethnicity), 3.6% Two Races or more
Age: Chart of age distribution among surveyed HubSpot employees. 12.3% 16-25, 66.2% 26-35, 17.7% 36-45, 3.2% 46-54, 0.6% 55 and over
Gender
Gender*: Chart of gender distribution among surveyed HubSpot employees, 53% Men, 46.9% Women, 0.2% Non-Binary
Ethnicity
Ethnicity: 65.3% White, 0.1% Native Hawaiian or Other Pacific Islander, 0.1% American Indian or Alaska Native, 13.7% Asian, 8.8% Black or African American, 7.5% Hispanic or Latino, 0.9% Other (the options do not describe my race/ethnicity), 3.6% Two Races or more
Age
Age: Chart of age distribution among surveyed HubSpot employees. 12.3% 16-25, 66.2% 26-35, 17.7% 36-45, 3.2% 46-54, 0.6% 55 and over
* We have removed 'Not Declared' data within this category.
We round to one decimal place throughout the report. This rounds the population of certain racial/ethnic groups to 0.0%, though the actual total of these employees is greater than zero.

Self-Reported Categories

We recognize that age, gender, and ethnicity are imperfect categories. So, we collect self-reported data annually to better understand how HubSpot employees identify. This survey is entirely optional and voluntary. Of the 55% of employees who chose to identify:

  • 27.0%

    are parents

  • 13.3%

    are members of the LGBTQ+ community

  • 1.5%

    are non-binary*

  • 1.0%

    are transgender

  • 9.8%

    are persons with disabilities

  • 1.2%

    are veterans

  • 44.9%

    are first-generation**

*Non-binary data reflects the self-reporting survey population only. The non-binary data earlier in the report reflects EEOC data.
**This data reflects our U.S. employee population only.

Beyond The Numbers

Here are some of the developments, initiatives and investments we've made over the past year to help build more diverse and inclusive communities for the future.

Yamini Rangan became our CEO, making HubSpot a female-led company with four women on our executive leadership team, and four women on our Board.

We introduced the 5Rs initiative, including a global Week of Rest and No Internal Meeting Fridays, to help employees battle burnout and prioritize mental health.

To invest in growth and career development of our BIPOC employees, HubSpot introduced mentorship programs including the Uplift Initiative and RISE.

As part of our $20M commitment to social impact investing, HubSpot invested $7.5M in support of Minority Depository Institutions (MDIs) to help close the racial wealth, health, and opportunity gap.

Download the 2022 Diversity, Inclusion, & Belonging Report

Download 2022 report

Past Reports

Want to learn more about HubSpot's diversity, inclusion, & belonging journey? Check out our past DI&B Reports and diversity data below.

We'd love to get to know you.

Browse our open positions, find a job you love, tell imposter syndrome to take the day off, and apply.

See all open positions